
In 2026, most marketing departments have moved away from evaluating design solely by whether it looks “nice” or “creative.” Today’s marketers and designers, through data integration and analysis, can trace the exact moment when, and usually how, a user interacts with a visual element.
You can break design KPIs down into three basic tiers based on the customer journey (Marketing Funnel): Awareness, Engagement, and Conversion. (The fourth step in the marketing funnel, they return and tell others, can be measured by scanning social media for brand mentions and use of @ tags as well.
Conversion is the ultimate goal of your design. What will your design help the customer do? A purchase, sign-up, subscribe, like, download, donate, etc.
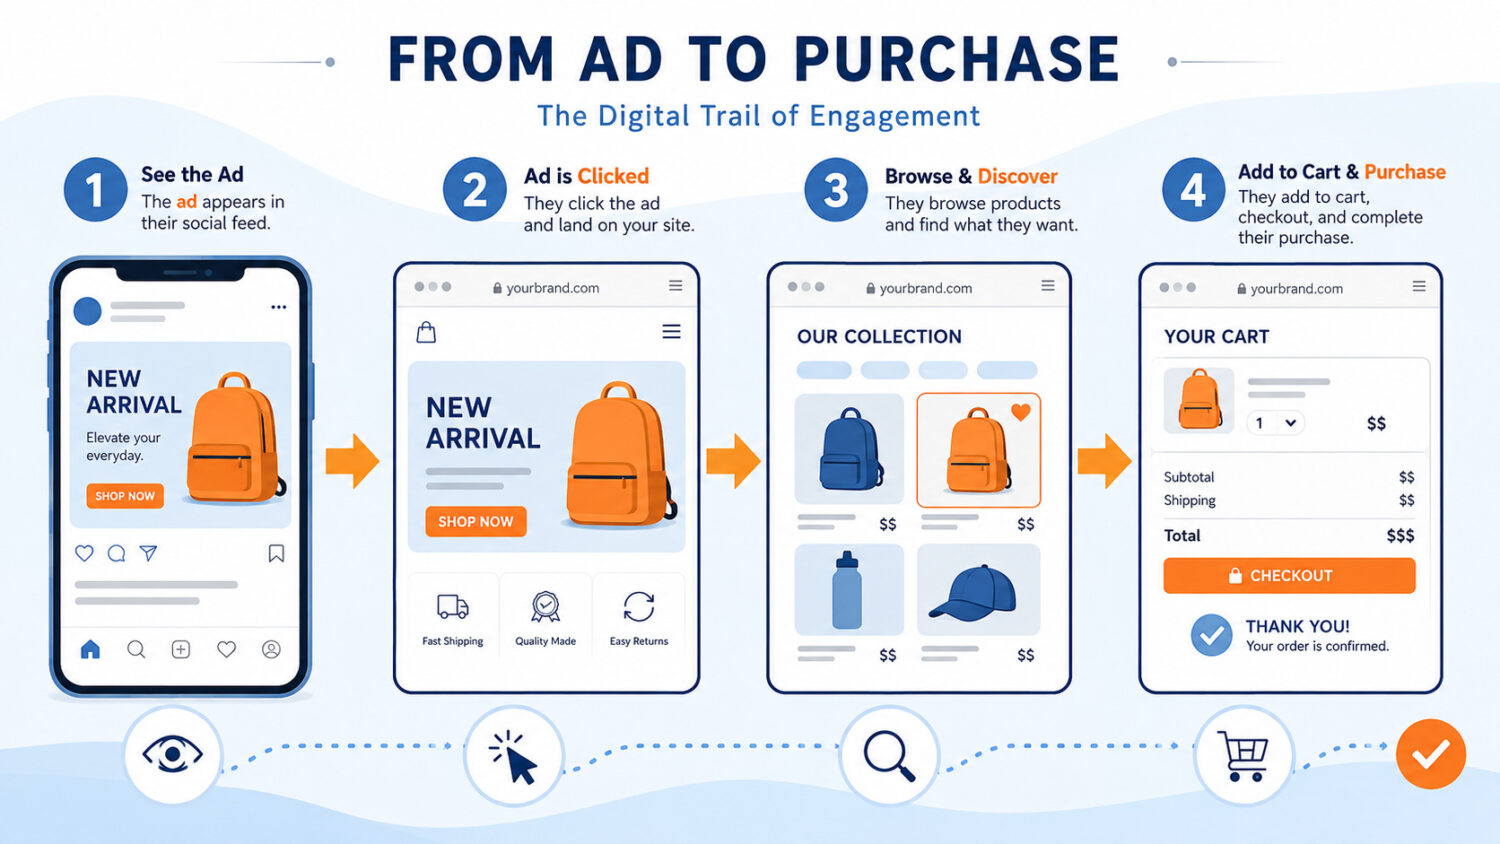
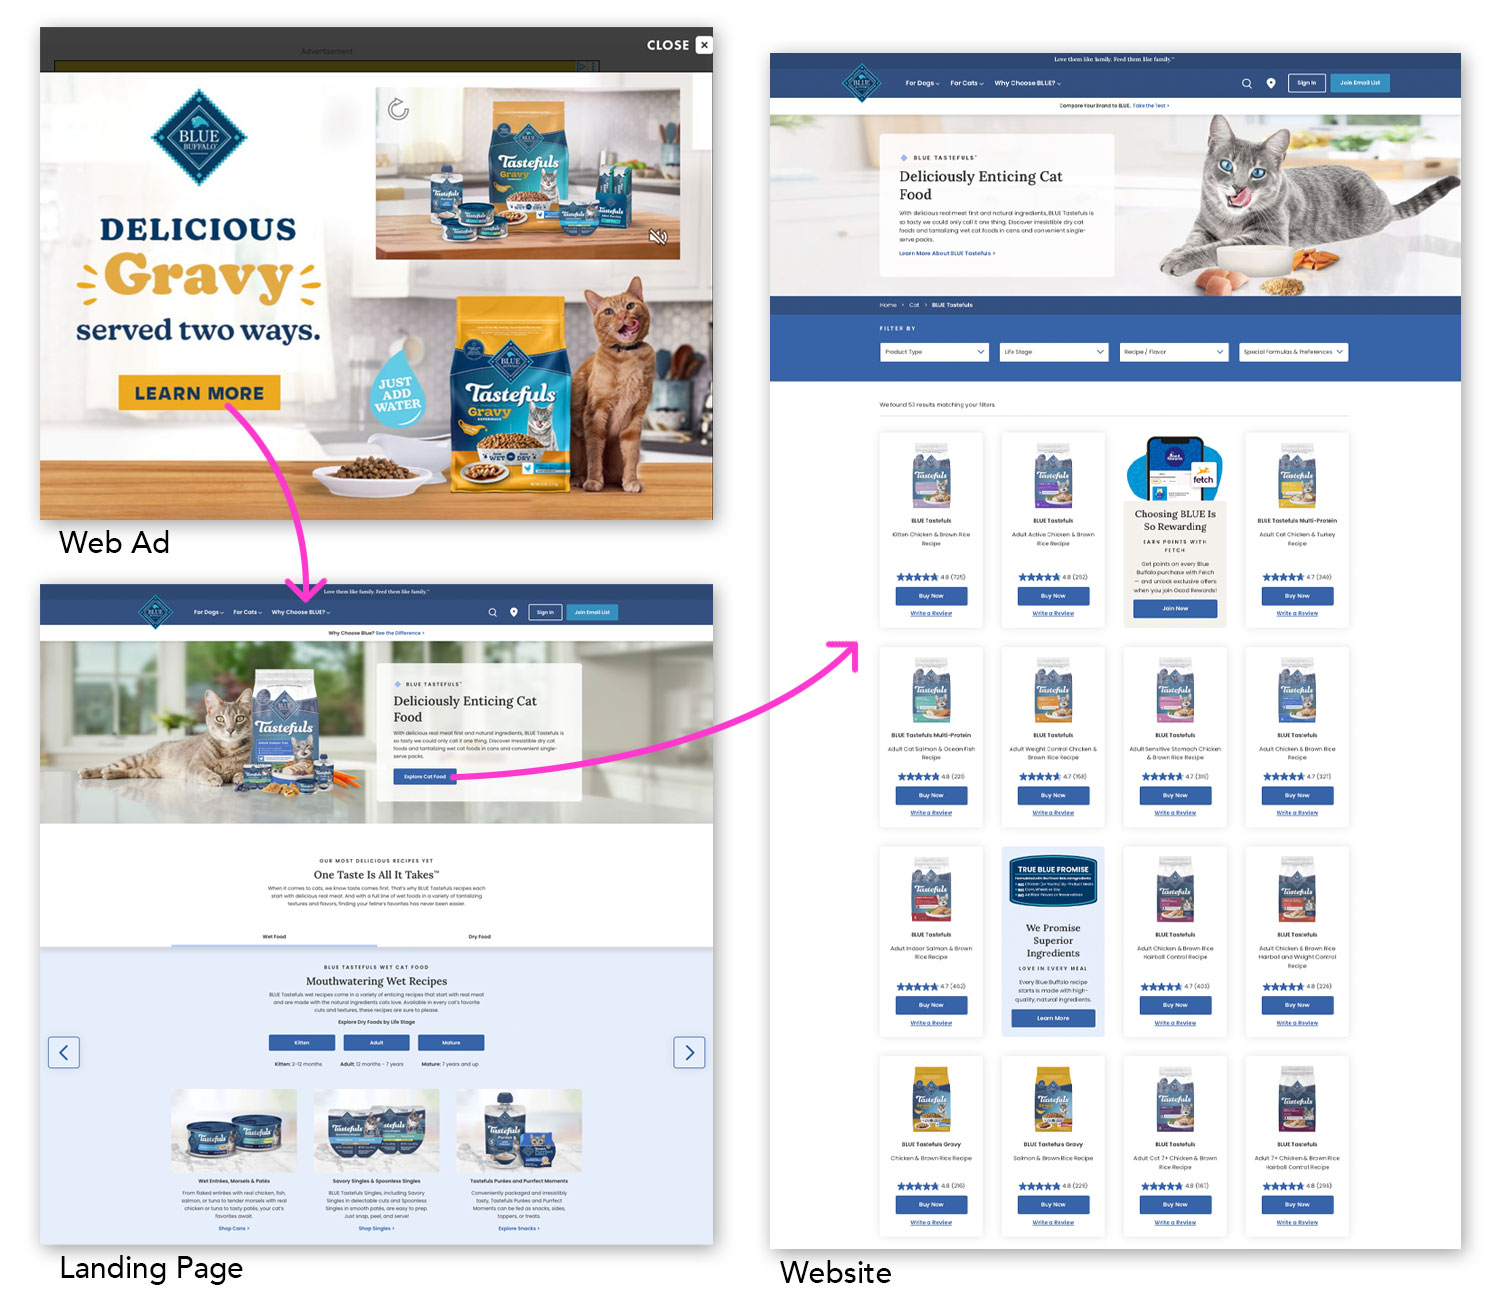
The 3 Basic Tiers of Design KPIs (Key Performance Indicators)
1. Awareness Metrics (Top of Funnel)
These measure how effectively a design catches a user’s eye and holds their attention in a crowded space.
- Impressions & Reach: How many times the design was displayed vs. how many unique people saw it.
- Thumb-Stop Ratio (Hook Rate): A massive metric for video in 2026. Out of 100 people who scrolled past a video, how many watched past the first 3 seconds? This evaluates the immediate visual impact of the thumbnail, typography, or opening frame.
- Average Watch Time / Completion Rate: Did the video or animation keep them long enough to deliver the marketing message?
2. Engagement Metrics (Middle of Funnel)
These prove that the design didn’t just get looked at—it actually intrigued the audience enough to interact with it.
- Click-Through Rate (CTR): The holy grail for layout designers. Out of everyone who saw the asset, what percentage clicked the link or button? (High CTR indicates that the visual hierarchy successfully guided the eye to the call to action).
- Interaction/Engagement Rate: The number of likes, shares, comments, or saves a social media graphic receives. If a design is highly shareable, the branding is on point.
- Scroll Depth & Time on Page: For landing pages and digital brochures, this tracks how far down a user scrolled before leaving. (If they stop scrolling halfway down, the layout or visual interest likely died there).
3. Conversion Metrics (Bottom of Funnel)
These connect the design directly to revenue, which is what corporate leadership cares about most.
- Conversion Rate (CVR): The percentage of users who complete a desired action (such as buying a product or signing up for a newsletter) after clicking through.
- Bounce Rate: The percentage of visitors who land on a page and immediately leave without interacting. A high bounce rate usually points to a jarring mismatch between the ad they clicked and the landing page design.
How Metrics Map to Specific Marketing Materials
You can understand exactly how your designs are tested in the real world by looking at this breakdown:
| Marketing Material | Primary KPIs Tracked | What the Data Tells the Designer |
| Social Media Ads & Smartphone Video | • Thumb-Stop Ratio (watch first 3 sec.) • CTR (Click-Through-Rate) • Video Completion Rate | Did the colors/motion hook them? Did the visual hierarchy make the offer clear enough to click? |
| E-commerce & Landing Pages | • Conversion Rate • Bounce Rate • Scroll Depth | Is the layout confusing? Is the CTA button high-contrast and easy to find? Is the product photography clean? |
| Email Marketing Graphics | • Click-to-Open Rate (CTOR) • Unsubscribe Rate | Once they opened the email, did the graphic layout motivate them to click, or was it a wall of text? |
| Print Materials (Flyers, Billboards) | • Unique QR Code Scans • Custom Promo Codes | Because print lacks digital tracking, designers use unique URLs or QR codes to see if the print ad actually drove digital action. |
A simple introduction to Marketing KPIs
The easiest way to introduce this concept is through A/B Testing (Split Testing).
Design two variations of the exact same social media ad or landing page hero section. Change one or two variables (for example: Version A has a green button and a photo of people with the product; Version B has a red button and a photo of only the product). The marketing team would run both simultaneously, review click-through rates, engagement, and conversion rates, and see which one connected best with the audience.
Metrics and the Marketing Funnel
Measuring the success of your marketing efforts is an important part of any business or organization. Below is an infographic showing which metrics are used at each level of the marketing funnel. Below that is a deeper explanation of the metrics used to measure success in the funnel.
Below is the same graphic we looked at on the marketing funnel page, but we’re going to look at it through the lens of marketing analytics and metrics. This lens tries to give us measurements to answer the question, “How do we know if our marketing material is working?” Another more specific questions would be, “Which of our three new November social media ads are driving more sales of our holiday products?”
- Marketing Piece / Action
The second column gives an example of the marketing piece that might work for that level in the funnel. - Metric
The third column shows how we could measure the success of the first column. - Engagement
The last column shows the average number of people who engage at each level of the funnel. This is an across-industries average. Some industries and product categories will be higher, some will be lower.
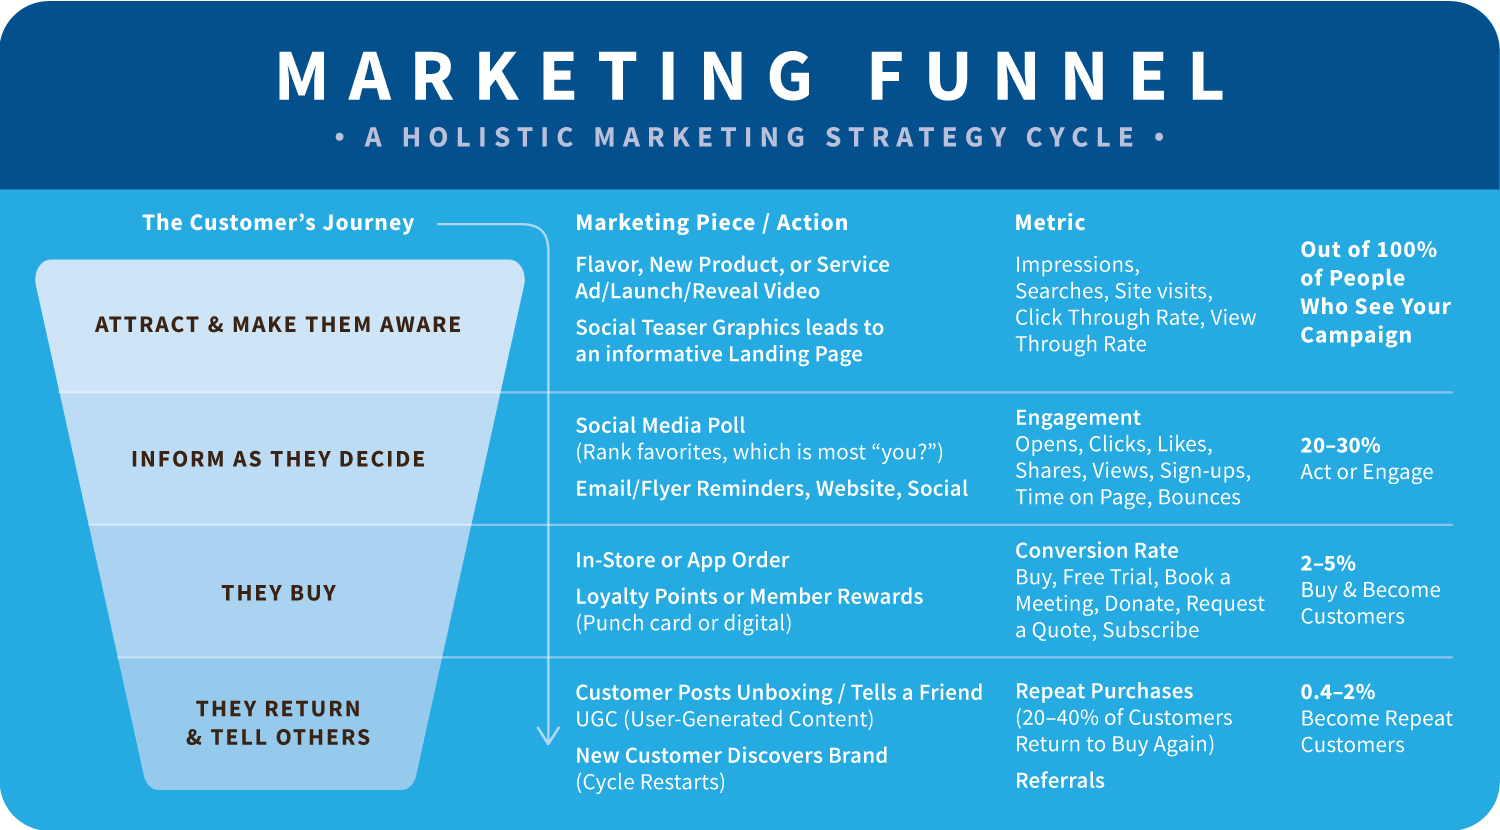
Note: Actual percentages vary widely by industry, audience intent, and campaign quality — so these are general, cross-industry benchmarks, not guarantees. They’re grounded in funnel benchmarks used across digital and traditional marketing today.
1) Awareness (Top of Funnel)
Goal: Get your brand seen or noticed — broad reach.
Metrics
- Impressions / Reach (Exposure) — % of people who saw your ad, post, or message. Example: If 100 people saw a billboard or social post, that’s 100% awareness at this stage.
- Reach Growth / Brand Mentions — how many new people are now aware vs returning. Useful for non-digital (TV ads, print) as well as digital.
- Brand Search Lift — how many more people searched your brand name after seeing the campaign.
Engagement Signals (still awareness-adjacent)
- Click-Through Rate (CTR) — % of people who click after seeing something. Digital expectations: ~1–5% CTR for paid ads and email links.
- View-through Rate (for videos) — % watched at least some of your ad.
Typical Transition Expectations
- From 100 people who see your campaign → 20–30% will take an initial interest action like click, search your brand, or revisit your site.
2) Consideration / Interest (Mid Funnel)
Goal: Prospect engages, learns more, or signals interest.
Metrics
- Engagement Rate — likes/comments/shares or time spent with content.
- Bounce Rate / Time on Page — lower bounce + longer time = stronger interest.
- Repeat Visits / Return Rate — % who come back to your site or content.
- Content Actions — downloads, video completions, webinar sign-ups, form fills.
- Email Open & Click Rates — a key measure of interest (e.g., 18–28% open, 2–5% click typical).
Typical Transition Expectations
- From 100 people who engaged at awareness → 20–30% take a mid-funnel action such as clicking deeper, opening an email, or engaging with content.
In practice: If 100 people clicked on a social ad → you might see ~20–30 meaningfully engage with content or take another step.
3) Conversion / Action (Lower Funnel)
Goal: Prospect completes the desired action (purchase, signup, form submit).
Metrics
- Conversion Rate — % of people taking the final action. Example: Out of 100 visitors, 2–5% complete a purchase or form.
- Average across industries: ~2–3% overall conversion.
- Top performers: ~5–10%+ in strong funnels.
- Cost per Action (CPA) / Cost per Lead (CPL) — how much you paid per conversion or lead.
- Return on Ad Spend (ROAS) — revenue return per ad dollar spent.
- Cart Completion / Checkout Rate (for e-commerce).
- Lead Quality Metrics — % of leads that reach a sales-qualified status.
Typical Transition Expectations
- From 100 people who showed interest → ~2–5% convert into customers or qualified leads.
Example Translation:
If 100 people engage with content → ~2–5 make a purchase or complete a core conversion action.
4) Retention & Loyalty (Post-Purchase / Advocacy)
Goal: Keep customers coming back and referring others.
Metrics
- Repeat Purchase Rate — % who buy again.
- Churn / Attrition Rate (for subscription or membership businesses).
- Customer Lifetime Value (CLV) — projected revenue per customer.
- Net Promoter Score (NPS) / Satisfaction scores — likelihood of referral.
- Referral or Word-of-Mouth Conversions — % of new customers from referrals.
Typical Performance Ranges
- Repeat purchase — many industries see ~20–40% of customers return over time.
- Referral impact varies widely but is a strong long-term signal.
Putting It All Together: Example Funnel (Baseline 100 People)
| Funnel Stage | Typical % Progressing | Where They End Up |
|---|---|---|
| Seen Campaign (Awareness) | 100% | 100 people |
| Initial Click/Interest | 20–30% | ~20–30 people |
| Conversion / Sale | 2–5% of total | ~2–5 customers |
| Repeat / Loyal | 20–40% of customers | ~0.4–2 repeat customers |
Interpretation:
Out of 100 people who saw a campaign, it’s common to see about 20–30 take an interest action and 2–5 complete the core conversion. A portion of those become repeat or loyal, depending on product and nurture efforts.
Quick Glossary
- Impressions/Reach: How many times your content was shown.
- Clicks / CTR: (Click-through-rate) How many people clicked compared to how many saw it.
- Engagement: Likes, comments, watches, time spent — signs of interest.
- Conversion: The action you want (buy, sign up, call).
- CPA / CPL: (Cost per acquisition, cost per lead—to get a paying customer.) What you paid for each outcome.
- ROAS: (Return on ad spend) What you got back financially from your spend.
- Retention: Repeat business and long-term value.